When I did part one I intended to wait until all of the write-in votes were counted and tallied before continuing, but it appears that process will be very time-consuming and drag out over the next couple weeks. So I will save the third part for that facet of the evaluation I wasn’t anticipating would take so long and carry on with what we do know to date, beginning with the rest of my predictions. I’m still working in reverse order.
On the Wicomico County level, Donald Trump will carry the county with ease, with 63.7% of the vote compared to 32.8% for Hillary. Gary Johnson will hover around 2.3% here and Jill Stein at 0.4%; in fact, Evan McMullin will beat her…
I keep making the mistake of thinking Wicomico County is more conservative than reality bears out. Trump won Wicomico County, but underperformed my expectations by a full 10.6 percentage points (53.1% vs. 63.7%.) Hillary received 8.8% of my overage, going from the 32.8% I guessed to the actual 41.6%, while Gary Johnson was the recipient of a small portion as well, outperforming with 3% against the 2.2% I predicted.
But it was the Green Party candidate Jill Stein who vastly outperformed, going from a cipher to a semi-cipher with 1%. She received 388 votes, and with 526 write-in votes to allocate – a total which presumably includes a batch for non-candidates like Larry Hogan or Mickey Mouse – I think Stein will end up beating McMullin after all. He needs nearly 3/4 of all the write-in votes and that’s a tall order.
The suspense will be much less in Maryland, where Trump will lose but not as badly as polls once suggested. Out of 2.6 million votes cast (again, down slightly from 2012) Hillary will get 56.1% and Trump 38.7%. Among the rest, Gary Johnson will get 3.3%, Jill Stein will pick up 1.2%, and write-ins the rest.
Turns out turnout wasn’t even as good as I thought, even knowing the high number who voted early. As of this writing, there were 2,545,896 Maryland votes for President, and you’re asking a lot for a 2% undervote on that part of the ballot (although it is possible.) But Hillary picked up an “extra” 3.5% in the state, a total that Trump exceeded by underperforming my estimate by 3.8%. (It is 59.6% for Hillary vs. 34.9% for Trump.) Gary Johnson also came up short, getting 2.8% vs. the 3.3% I projected, but Jill Stein came close with 1.3% as opposed to the 1.2% I predicted. But the write-ins I guessed would be less than 1 percent are (as a combined total) leading Stein 32,957 to 32,406. (Worth noting: over 6,000 absentee/provisional votes have been deleted from the write-in totals, so the final tally among them may be closer to 30,000 rather than the 40,000 I noted in part one. Still, that is over thrice the number of write-ins cast in 2012 at this point – although a high number will be non-official candidates as well.)
For the last part, I’m going to bring in my predicted electoral map.
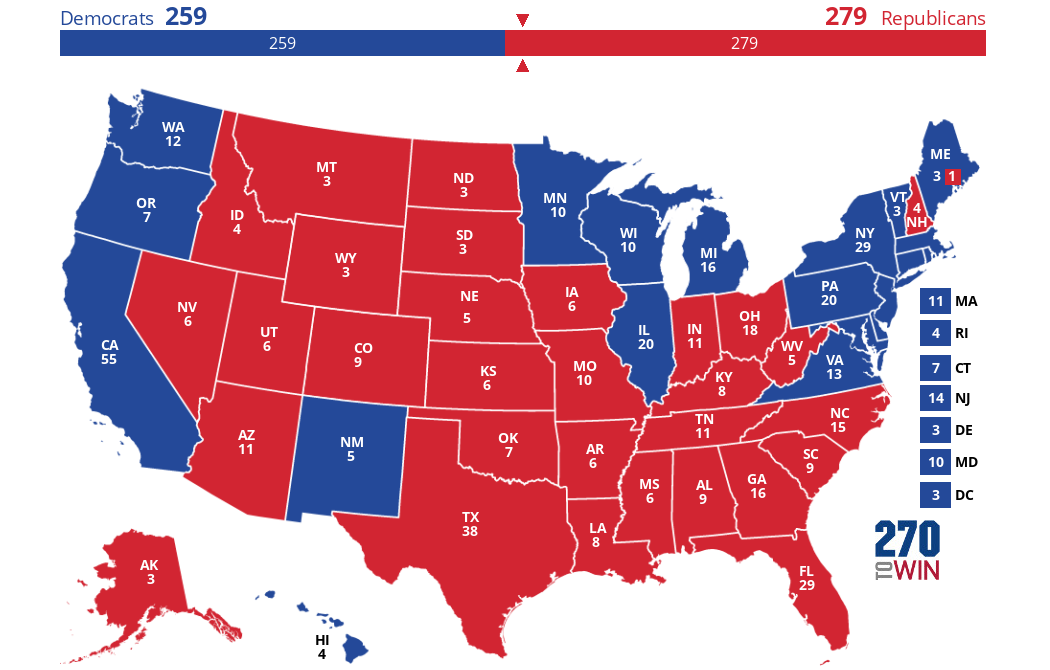
The important race: Hillary Clinton will pull out a fairly close popular vote race by 1 or 2 points nationwide, but fails to eclipse 50 percent just like her husband. However, there is a highly distinct possibility we may live the 2000 election all over again: the Electoral College very well could finish 279-259 Trump and the straw that breaks Hillary Clinton’s back will be losing Florida. Trump will win 30 states but Florida will be the dagger the GOP regains to defeat Hillary. Also from the 2012 map Trump will regain Colorado, Iowa, Nevada, New Hampshire, and Ohio for the GOP, plus one Electoral College vote in Maine. (That one vote in Maine could be key if Florida and Pennsylvania trade places, with the former going to Clinton and the latter Trump. If Trump takes one Congressional district in Maine he would prevail 270-268, but if that elector decides to go with the other three Maine electors it becomes a tie.)
The reasons neither candidate breaks 50 percent: about 4.5% for Gary Johnson, 1.5% for Jill Stein, and various write-in candidates will split roughly 2% of the vote. This means Hillary beats Trump by something like 46-45 or 47-45.
It does not look like Hillary Clinton will win the popular vote by more than a margin that would trigger an automatic recount in many states (0.5%.) Both Clinton and Trump are hovering in the 47 to 48% range; based on standard rounding rules it’s 48-47 Hillary right now. So I was actually correct on margin.
But I’m intrigued by the states I messed up on. Let me share a little secret with you: my prediction map was based on a very simple formula – take the last poll from each state and if it was anything less than Clinton +3 give it to Trump. After all, people tell me I barely know Maryland and Delaware politics, let alone the dynamics of swing states I have never been to. But I did sense there was a Bradley effect going in that people either wouldn’t admit to a stranger they were voting for Trump or they were convinced that where there was the smoke of allegations over dirty dealings by Hillary Clinton there was the fire of influence-peddling, despite the FBI clearing her twice.
So Donald Trump did not win Colorado, Nevada, or New Hampshire as I predicted (although there may be an automatic recount in New Hampshire based on margin.) But I think he will gladly trade those 19 electoral votes for the 46 he gets by winning Michigan (maybe, as that is also likely an automatic recount margin), Pennsylvania, and Wisconsin (!). Trump lost Colorado by 3 and Nevada by about 2, so they were close as were Pennsylvania and Wisconsin, both taken by Trump by about 1 percent. Even if they find a trunkful of votes somehow deposited under home plate where Tiger Stadium once stood, though, Trump wins the Electoral College by 290-248. (If Michigan holds it’s 306-232, not quite the 332-206 Obama was re-elected with, but a healthy margin nonetheless. Even without Michigan, though, Trump beats Bush’s 2004 re-election, let alone the 2000 race.)
Yet despite underperforming my expectations, the Libertarian Gary Johnson blew away his party’s previous best national showing with 3.3%. Jill Stein actually did worse than I expected, garnering just less than 1% nationally. On both sides of the spectrum, those who wavered in their support for alternative candidates fell prey to the siren song of the duopoly who continually tries to convince people a vote other than R or D is “wasted.” And that’s the way the establishment continues to reign. So let me digress for a moment to wrap up the prediction part of this post…
First of all, national turnout will be about 124 million votes, which will be down from 2012 but not as bad as I once predicted.
Turnout was better than I guessed, but it will still be down from 2012. (By the way, I thought someplace I wrote it was 128 million in 2012, but the undervotes pushed it beyond 129 million casting a ballot. So far they have counted 126.8 million ballots.)
…and pick up with my thoughts on why Trump did so well where he was expected to lose.
If you see a common theme in those three states (as well as Ohio) this election was all about trade and job creation. These are the voters who have seen their livelihoods taken away by NAFTA and the relocation of manufacturing to other nations like China, so they have a latent animus against the Clinton family to begin with.
Yet these were also the union voters who either went with their union leadership to support Al Gore, John Kerry, and Barack Obama, or (more likely) just said the heck with it and stayed home because they liked neither choice presented by the duopoly. And let’s face it: to these working-class people George W. Bush only became president because his dad pulled the strings, John McCain wasn’t appealing because he was a Washington insider, and Mitt Romney was the subject of their class envy. But Donald Trump made the election about things they cared about with his populist, pro-America appeal, so they turned out for him.
And it’s worth adding that pollsters tend to call those they know are likely voters. As I noted, much of this group stayed home for the last several elections and they’re skeptical enough of the press to deceive the pollsters if they do happen to call – thus, all the pollsters overestimated the base of support for Hillary in these states.
If I have a perception of these Trump voters, they remind me of my dad: he was a union worker for over 35 years, was drafted into the Army and served his hitch (fortunately in the period between Korea and Vietnam), and he worked for several years at a friend’s greenhouse even after he “retired” from his longtime employer (a concrete block plant that is no longer in business.) I have no idea if he voted, but if he did he fits well the profile of one of those Trump supporters who came out of the woodwork.
So I’m left with the surprise and shock I received when I opened up my browser to the New York Times website where I was tracking the results and finding they were predicting a Trump victory was more and more likely. It was surprising because it was lining up with my EC prediction, and shocking once the results began rolling in from Michigan, Pennsylvania, and Wisconsin. Conversely, I’m not shocked by the discord in the election’s wake, just saddened (remember, I didn’t vote for Trump either – but I’m not going to march in the streets about it.)
My last part is going to wrap up the predictions once I get the write-in results. Already Darrell Castle is at 180,000 votes nationwide and that will hopefully increase as states where he was a write-in tally their ballots. Considering the Constitution Party has never broken 200,000, it’s a start. I’m going to be interested to see how Castle fares in Maryland and Delaware.
I suppose the next great political event around these parts will be the runup to the Maryland GOP Fall Convention that I will miss (but only in the sense I won’t be there – as it turns out I have much better plans for that particular weekend) but will elect a new party Chair whose top job will be to re-elect Larry Hogan in two years.
In the meantime, I may do a little work on my book this weekend. I also found out there will be a change afoot with this site, so stay tuned.


